Oshyn DevOps: Metrics & Alerts in a Production AWS Sitecore Solution


Jan 02, 2020
A major tenet of DevOps is to address small issues before they become big issues. An important method for discovering issues when they’re small is to set up monitoring with alerts. At Oshyn DevOps, we make sure that we have alerts on every piece of the Sitecore solution that can keep us aware of the health of the system and notify us of any changes that require investigation.
In the production monitoring space, the first two things we tend to look at for Sitecore environments are:
Metrics - This is the data generated by the different cloud resources such as: disk space, CPU and memory on VMs, throughput on a WAF (web application firewall), database connections, distributed cache CPU, connections, etc. These metrics number in the tens of thousands for any reasonably-sized, highly-available Sitecore solution.
Alerts - We create alerts by taking the above metrics and putting thresholds on them. When a threshold is met, the appropriate staff is notified, and the issue is remediated before it becomes an issue for the site.
Understanding how these alerting mechanisms work in your cloud hosting provider is crucial to the overall uptime of your Sitecore solution. This is one of the reasons Oshyn currently only supports DevOps for Azure and AWS. This article focuses on our highly-available Sitecore production monitoring in AWS, but Azure works exactly the same way (except with Azure toolsets).
For a typical highly-available production Sitecore implementation on AWS, Oshyn’s DevOps teams receive a minimum 50 different alerts—and typically over 100. A non-exhaustive list is:
| Group | Metric | Sample Threshold |
|---|---|---|
| AWS/EC2 | * for each VM | |
| Win | Memory Available | Less than 2GB |
| Win | LogicalDisk % Free Space | Less than 20% |
| Win | Web Service Connection Attempts/sec | Greater than 500 |
| Win | Web Service Get Requests/sec | Greater than 200 |
| Win | Web Service Current Connections | Greater than 1,000 |
| Win | Web Service Current Anonymous Users | Greater than 5000 |
| Linux | DISK_FREE | Less than 10GB |
| Linux | mem_used_percent | Greater than 75% |
| Linux | swap_used_percent | Greater than 75% |
| AWS/RDS | * for each RDS instance | |
| CPU Utilization | Greater than 85% | |
| Database Connections | Greater than 1,500 | |
| Freeable Memory | Less than 1GB | |
| AWS/ApplicationELB | * for each load balancer | |
| Request Count / Second | Greater than 1,000 | |
| Healthy Host Count | Less than 2 | |
| AWS/ElasticCache | * for each load balancer | |
| CurrConnections | Greater than 100 | |
| Freeable Memory | Less than 1GB | |
| CacheHits (per second) | Greater than 500 | |
| Log File Metrics | ||
| Errors in all Sitecore Instance Logs | More than 5 errors within 5 minutes | |
| Errors in Identity Server Log | More than 5 errors within 5 minutes | |
| Errors in XConnect Service log | More than 5 errors within 5 minutes | |
| Errors in XConnect Automation Engine log | More than 5 errors within 5 minutes | |
| Errors in XConnect Index Worker log | More than 5 errors within 5 minutes | |
| Errors in XConnect Processing Engine Log | More than 5 errors within 5 minutes | |
| External Sensors | * for each website | |
| HTTPS Certificate Validity | Up/Down | |
| HTTP/HTTPS Connectivity for External Users | Up/Down | |
| HTTP/HTTPS Connectivity for Content Editors | Up/Down | |
| HTTP/HTTPS Advanced Sensor for Search Results | Up/Down | |
| HTTP/HTTPS Advanced Sensor for Contact Us | Up/Down |
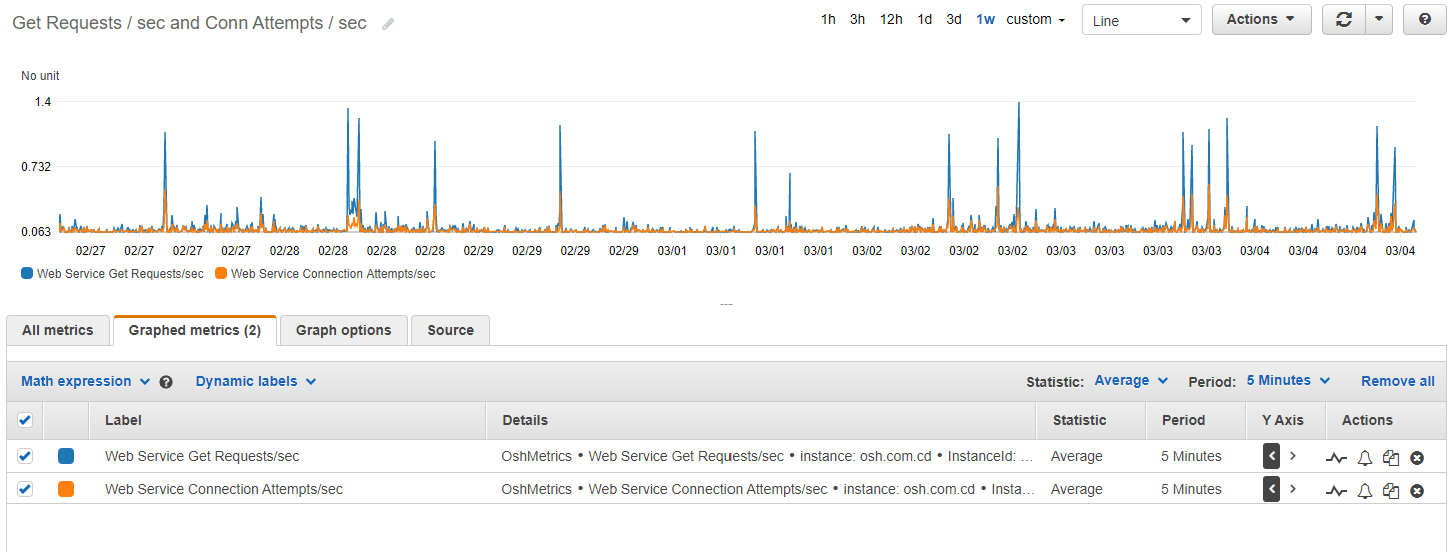
It’s important to note that the thresholds are adjusted based on the overall size of the resource and the utilization of the site we are monitoring. Having less than 1GB free memory is an emergency if the resource has 16GB, but isn’t if the resource has 2GB. Similarly, what constitutes an event that warrants further investigation also depends on the site we are monitoring. A spike in current connections greater than 1,000 for one website may be alarming but not for another. The only way to know is to monitor the site for some time prior to setting the thresholds. Using the CloudWatch metric tools, you can see over time what constitutes normal and can therefore set your thresholds to detect anything abnormal before it evolves into an outage event.

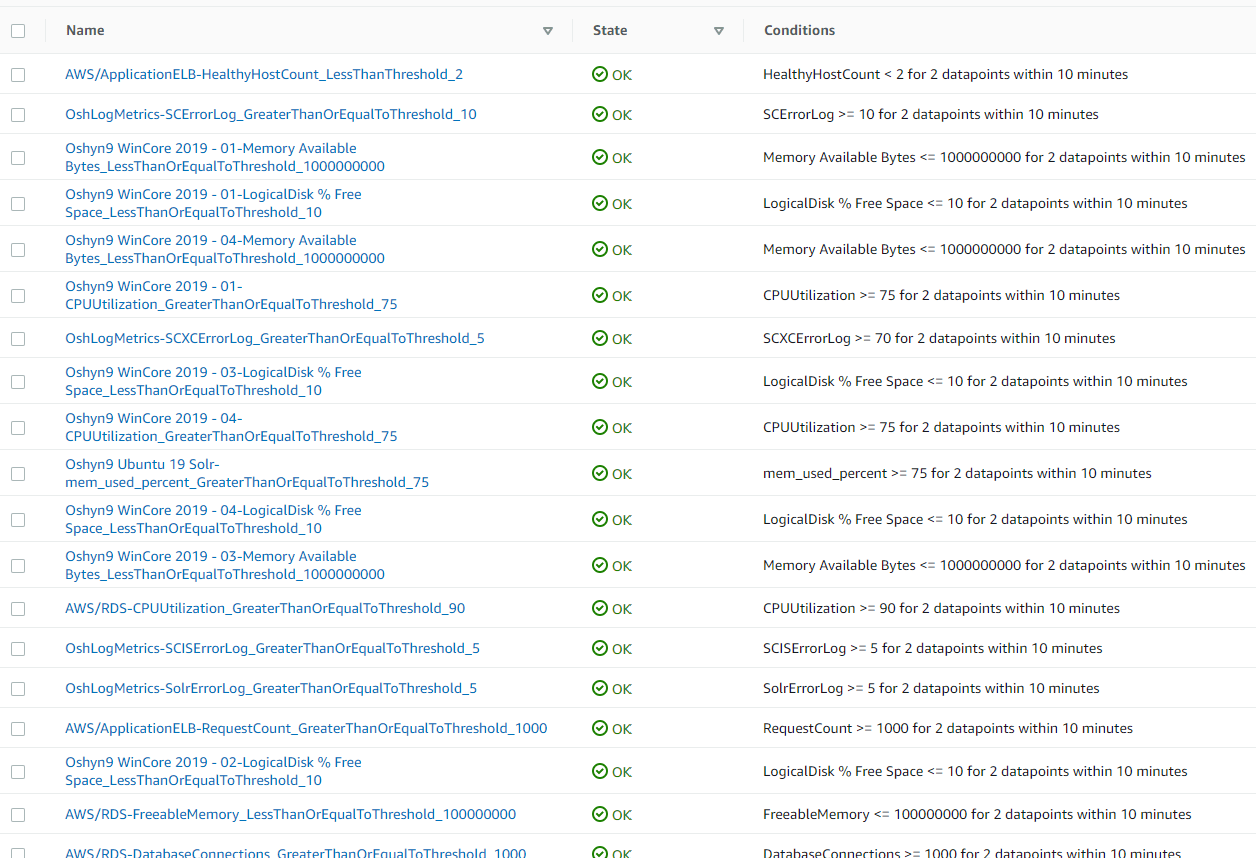
After the alerts are configured in CloudWatch, they look like this:

And they are replicated into Oshyn’s monitoring system, based on PRTG, which looks like this:

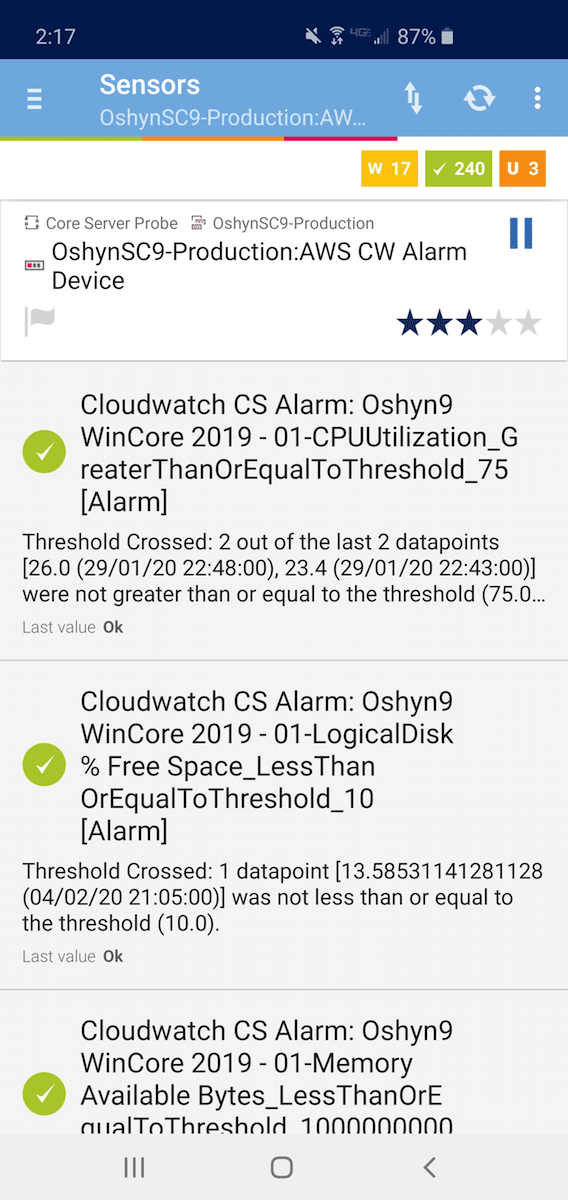
And like this on mobile:

When these alerts are triggered, emails are sent, messages are sent to a Slack channel, and push notifications are sent to apps running on mobile devices. This is how Oshyn DevOps is able to identify and remediate small issues before they become outages that cost your business lost sales and marketplace perception.
Frequently Asked Questions
AEM is built on Adobe Cloud Technology, which means easier access for both you and your assets from anywhere. You don't have to worry about the final content presentation on each platform or device.
Through modules for website creation, forms, mobile applications, communities, and assets, AEM streamlines web content management and delivery. When taken as a whole, these modules make AEM a fantastic CMS tool. With the help of the AEM CMS module, the business can create and manage websites from a single location.


