


Jun 11, 2019


I was recently given the task of digging into Sitecore Experience Analytics. After spending some time working on it, I found myself needing to create my own report. The documentation outlines how to create a report from scratch, but I had a few challenges while following it. I hope that sharing my experience can help others trying to customize their Sitecore reporting.
You must use Visual Studio and Sitecore Rocks to create a new report, so that was my first stop. Installing the tool was fairly easy. Just a note: make sure you choose the "Hard Rock Web Service" as Data Provider while configuring your connection. The Good Old Web Service, although "good", only shows raw values :) .
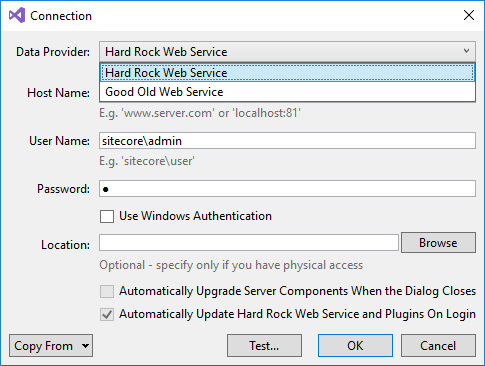
Sitecore Rocks Connection
So, you have installed Sitecore Rocks and successfully connected to your site. That means you are ready to follow Sitecore's user guide to create a new report.
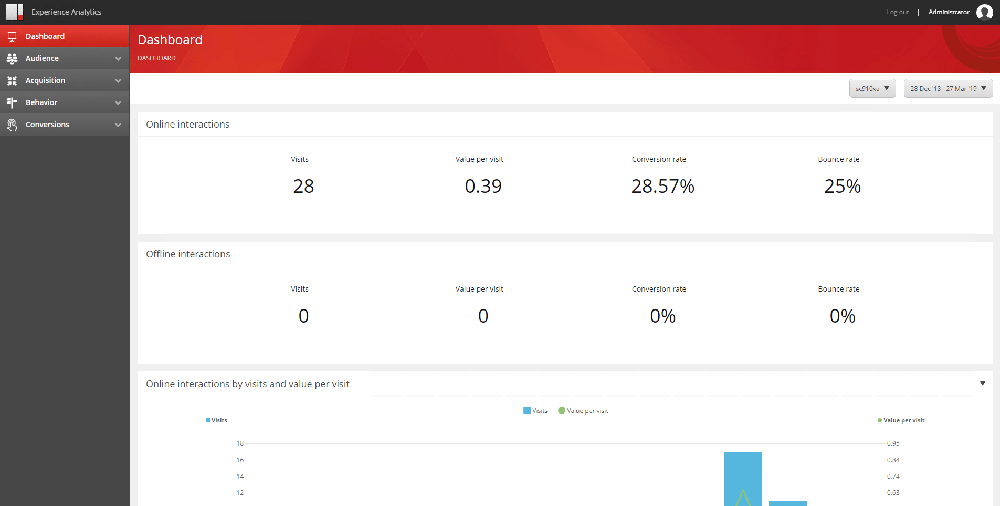
In my particular case, I intend to add a new report to the Dashboard to track offline interactions. This report will help me visualize how many visitors come to my website after receiving a postcard with a short URL to a Campaign landing page. In addition to the number of visits I would also like to view the value per visit, conversion rate, and bounce rate on the report. The end result should be a report very alike the online interactions report - but for offline.
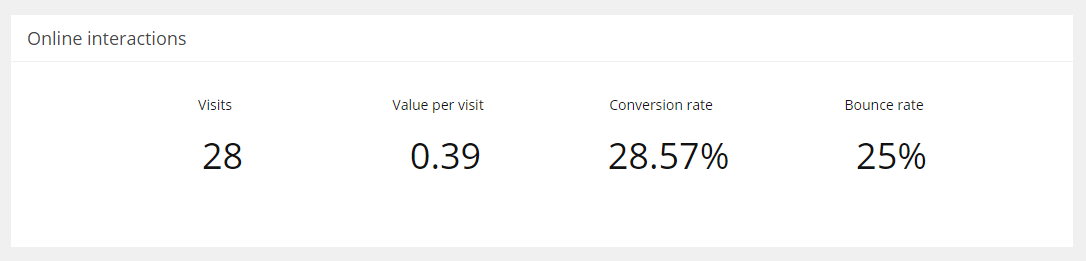
Sitecore Experience Analytics Dashboard Online interactions report
Since the report I wanted to create was very similar to an existing report, I decided to copy the existing one instead of creating it from scratch:
-
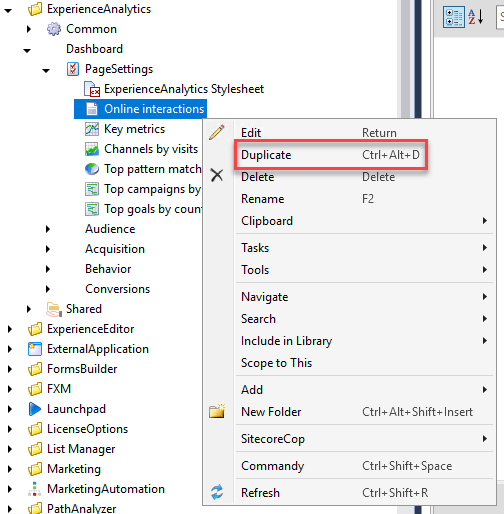
Navigated to the existing report
core/sitecore/client/Applications/ExperienceAnalytics/Dashboard/PageSettings/Online interactions
-
Right clicked the Online interactions report and selected Duplicate.
3. Entered the name of my new report
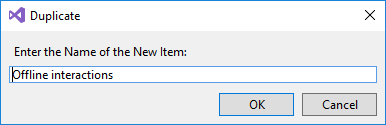
After my previous steps, I had a duplicate of the online interactions report. Because I intend to get a pretty similar report (but to track offline instead of online), I don't need to modify any of the Metrics or the Segment on the report.
What I need to change in this case is the report key from online to offline.
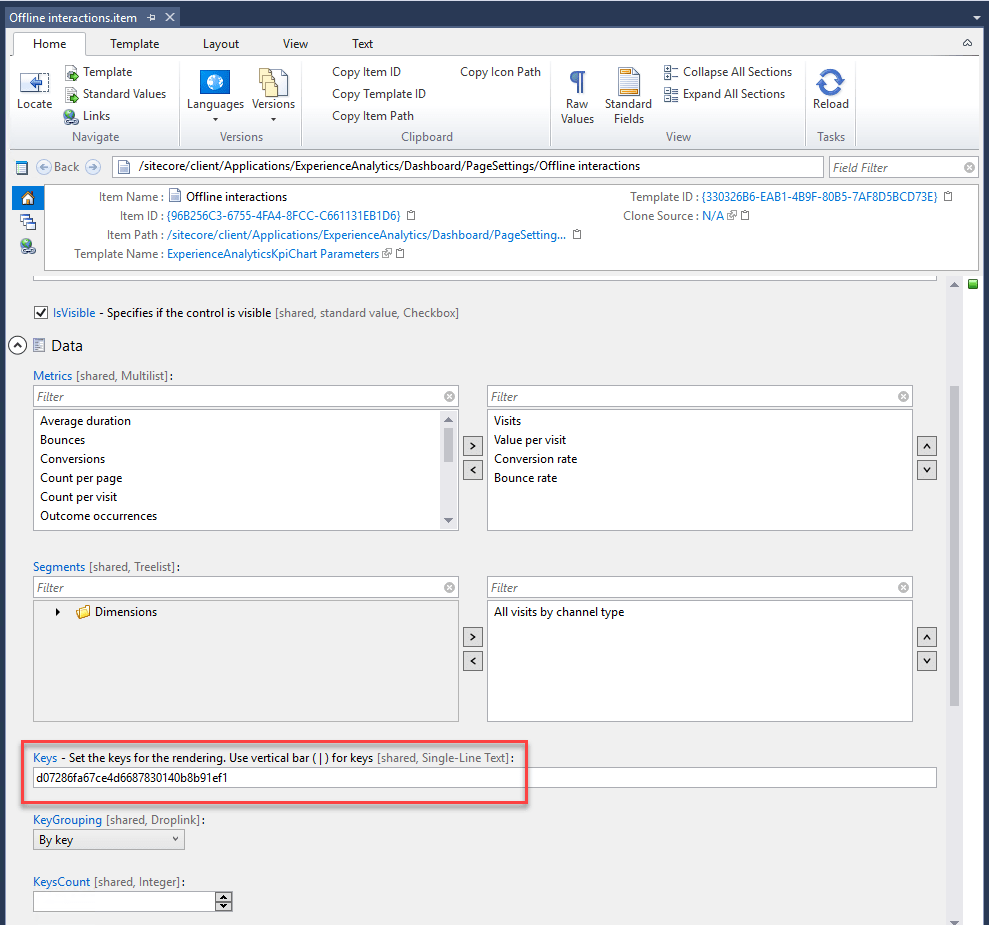
Sitecore Experience Analytics Report Configuration
To find my new key, I navigated to my Sitecore instance Marketing Control Panel and looked for channels taxonomy. I copied the Offline channel "Item ID", made it all lower case, and removed the dashes.
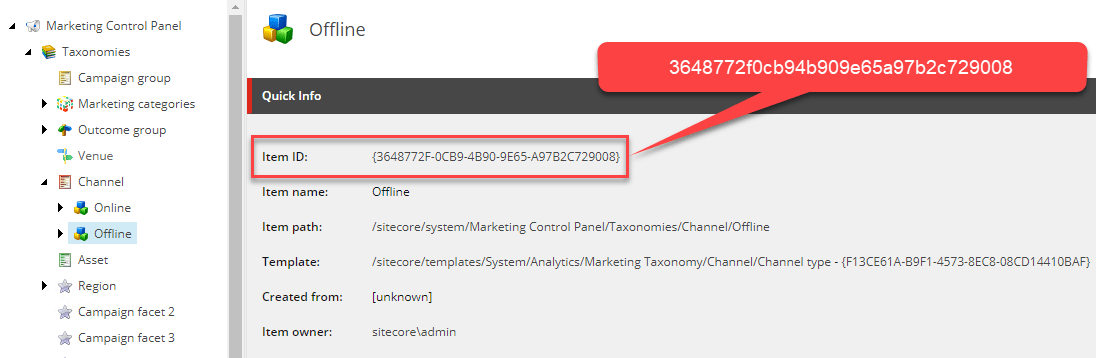
Offline channel item in marketing control panel taxonomy
Back to Visual Studio to replace the key value and save my changes.
Next, I needed to figure out how to display the report on the dashboard, so I went back to Sitecore's user guide and followed the steps to Add a chart component to a report. Again, because the report I needed was very similar to the online interactions report, I used that one as reference. So instead of adding a new rendering from scratch, I just duplicated the OnlineInteractions one.
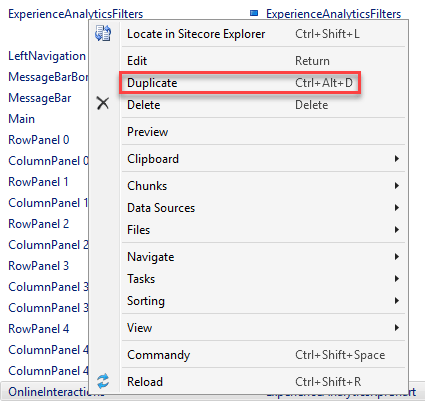
Sitecore Experience Analytics Item Options
I saved my changes and went straight to Sitecore to check my Experience Analytics dashboard.
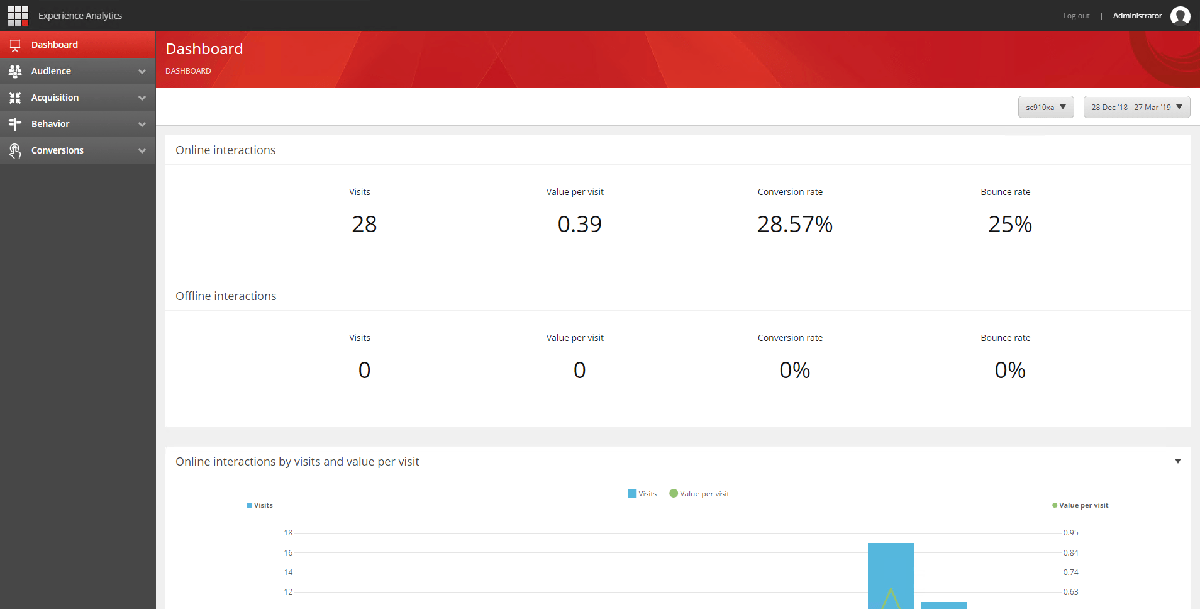
Sitecore Experience Analytics Dashboard with custom report
Good news! The report was there, but the presentation wasn't what I wanted; it was showing on the Online interactions section report. I couldn't find anything on the documentation about creating sections, so I had to figure it out by looking at the existing reports.
After a second look, I realized that there are RowPanel and ColumnPanel renderings on the reports layout controlling how the reports display.
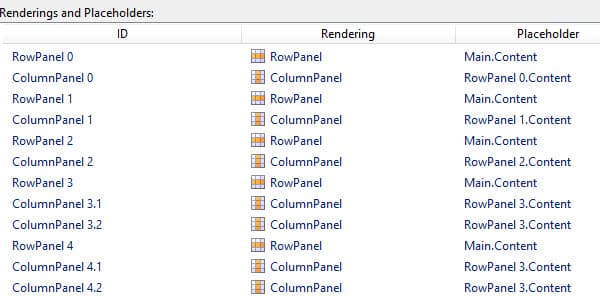
Sitecore Experience Analytics Dashboard layout
So I added a section to hold my report:
- Added a RowPanel and a ColumnPanel rendering to the page.
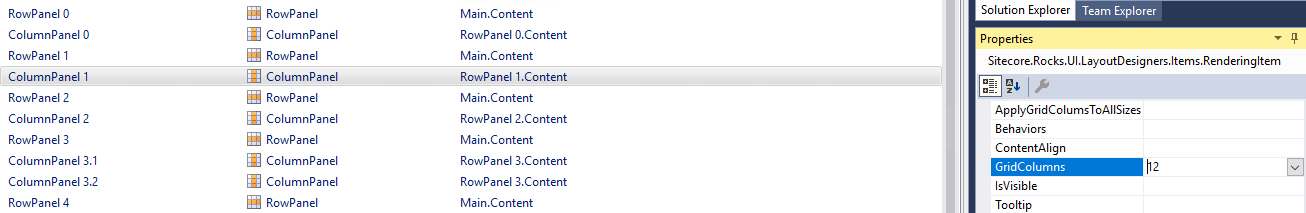
- Set the number of columns on the ColumnPanel rendering to 12, since I wanted the report to use the screen full width (6 columns is 50%).
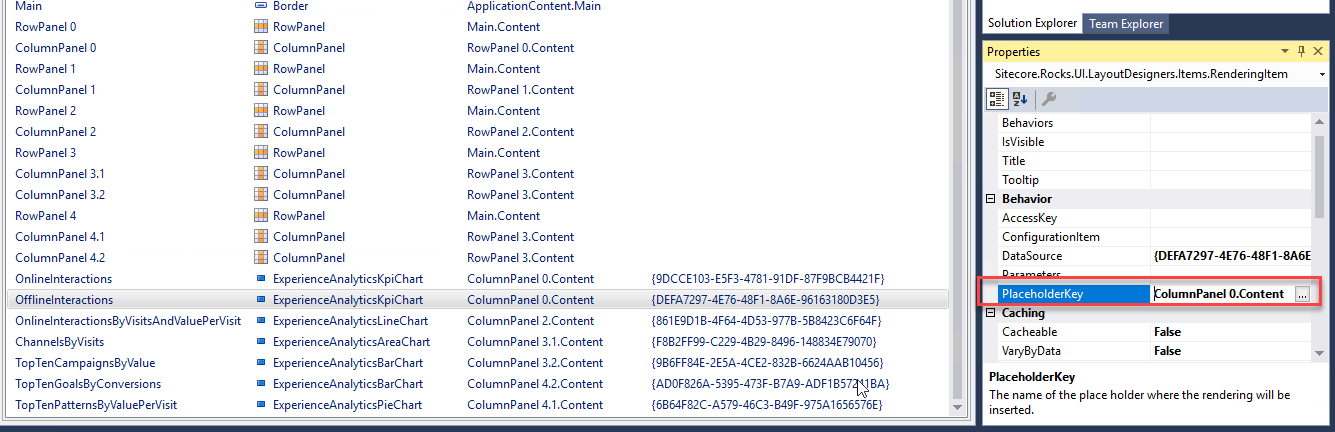
- Edited each rendering properties to select the desired PlaceholderKey by clicking the ellipsis.
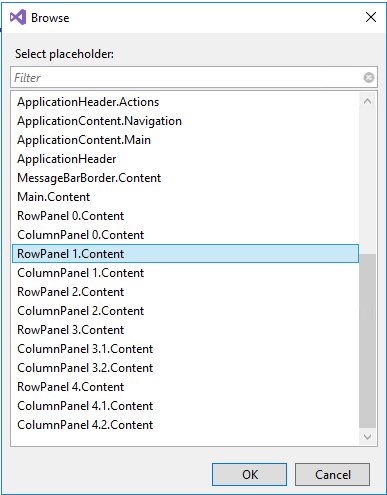
- Selected the desired placeholder for each item and hit OK:
- RowPanel 1: Main.Content
- ColumnPanel 1: RowPanel 1.Content
- OfflineInteractions: ColumnPanel 1. Content
- Saved all my changes and went back to Sitecore.
Finally, I was able to see my report the way I expected it to display.
Sitecore Experience Analytics Dashboard with custom report in separate section
Next, I'll be testing my report by hitting that short URL I mentioned at the beginning.


This site is protected by reCAPTCHA and the Google Privacy Policy and Terms of Service apply.